
It’s very common in programming to quickly test what we are doing and experimenting with specific code chunks each time testing the behaviour, style or even the UI flow. Let’s check how to Debug node app using chrome dev tools
Chrome dev tools it’s an easy way to start debugging your client-side code. Here are the steps on what you need to Debug node app using chrome dev tools.

Open your terminal
node --inspect Open a chrome window and type the following url: about://inspect
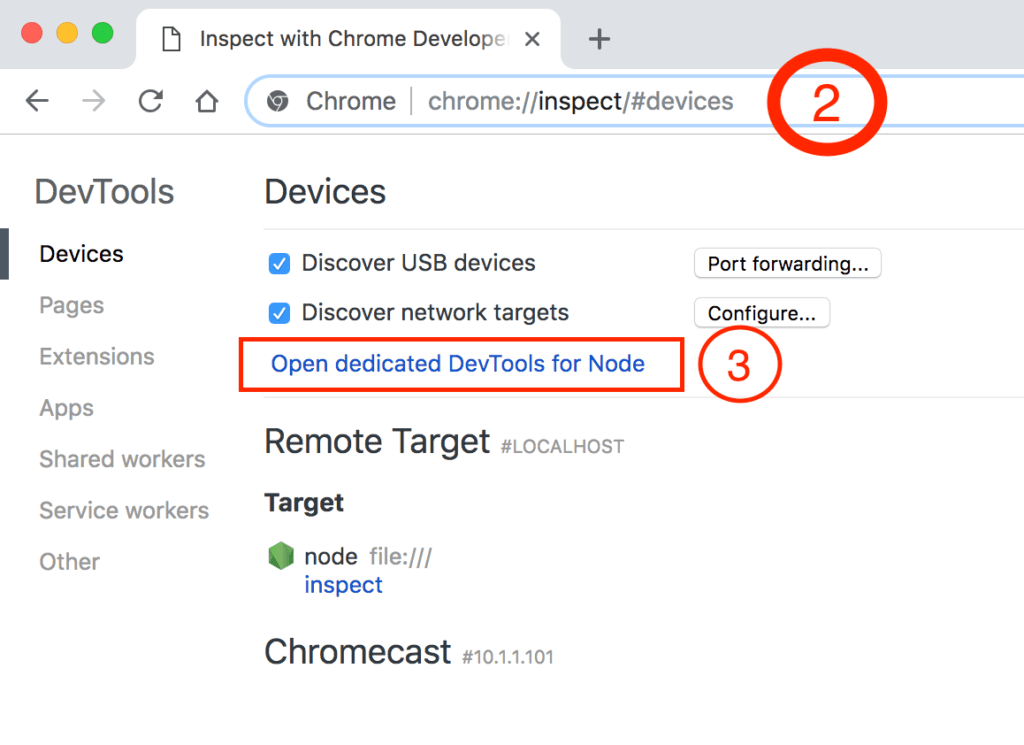
Next click Open dedicated DevTools for Node and you’ll have access to your node app in the browser DevTools
Now, we have access to the profiler, all the stack visualisation information, the code navigation facilities, a very cool debugger and much more!
[alert type=white ]💥Deploy github project to Heroku with custom domain💥[/alert]That’s it for now.
If you liked this article, then please subscribe to my YouTube Channel for video tutorials.